

Home | Testing Services | Technical Information | Consulting | Customer Services | Careers | Contact Us
![]()
►TOYS
►REGULATIONS OF DIFFERENT COUNTRIES

Acoustics
dB – decibel
The
sound pressure level, Lp, in dB’s is defined as 20 log p/po, where p
is the measured value in Pa and po is a standardized reference level
of 20 x 10-6 Pa – the threshold of hearing. Note here
that the word level is added to sound pressure to indicate that the quantity
has a certain level above the reference level and the symbol for sound pressure
level is Lp.
Lp = 20 log (P/Po) dB
Sine-Wave Language
The sine wave is a specific kind
of alternating signal and is described by its own set of specific terms. Viewed
on an oscilloscope, the easiest value to read is the peak-to-peak value (of voltage, current, sound pressure, or
whatever the sine wave represents), the meaning of which is obvious in Fig. 1.
If the wave is symmetrical, the peak-to-peak value is twice the peak value.
The common ac voltmeter is, in
reality, a dc instrument fitted with a rectifier that changes the alternating
sine current to pulsating unidirectional current. The dc meter then responds to
the average value as indicated in
Fig. 1. Such meters are, however, almost universally calibrated in terms of rms (described in the next paragraph).
For pure sine waves, this is quite an acceptable fiction, but for nonsinusoidal
wave-shapes the reading will be in error.
An alternating current of one
ampere rms (or effective) is exactly equivalent in heating power to 1 ampere of
direct current as it flows through a resistance of known value. After all,
alternating current can heat up a resistor or do work no matter which direction
if flows, it is just a matter of evaluating it. In the right-hand positive loop
of Fig. 1 the ordinates (height of lines to the curve) are read off for each
marked increment of time. Then (a) each of these ordinate values is squared.
(b) the squared values are added together, (c) the average is found, and (d)
the square root is taken of the average (or mean). Taking the square root of
this average gives the root-mean-square or rms value of the positive loop of
Fig. 1. The same can be done for the negative loop (squaring a negative
ordinate gives a positive value), but simply doubling the positive loop of a
symmetrical wave is easier. In this way the root-mean-square or “heating power”
value of any alternating or periodic waves can be determined whether the wave
is for voltage, current, or sound pressure. Such computations will help you
understand the meaning of rms, but fortunately reading meters is far easier.
Figure 1 is a useful summary of relationships pertaining only to the sine wave
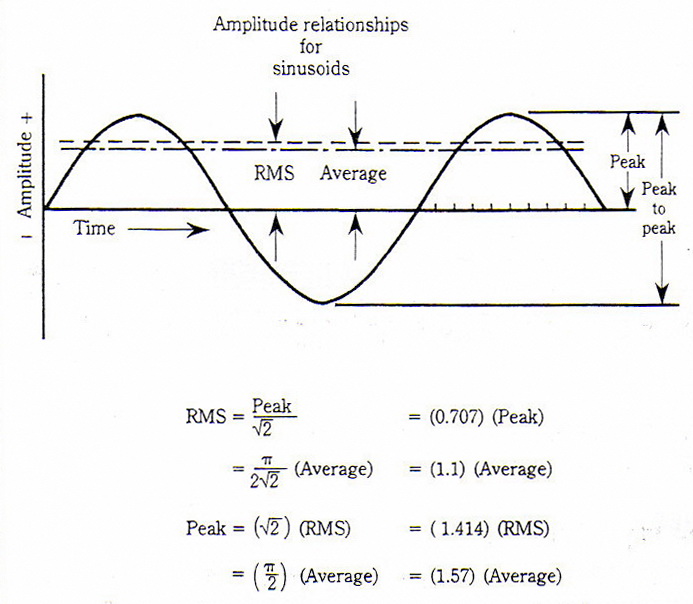
Figure 1
Equivalent Level, Leq
Leq is an
electronically calculated mean RMS level which integrated all the energy in a
signal measured over a certain time period, t. Leq can be considered
as the continuous noise which would have the same total acoustic energy as the
real fluctuating noise measured over the same period of time. The mathematical
definition of Leq is as shown in the illustration where
T is the total measurement time
p(t) is instantaneous sound pressure
po is the reference sound pressure (20 mPa)
![]()
For many purpose Leq is gradually taking over as the parameter being measured because it gives a measure of the acoustical energy as a single figure even for widely fluctuating noise. This is especially useful in connection with the evaluation of the risk of hearing impairment caused by exposure to high noise levels.
Average of sound pressure
levels
Let SPL1, SPL2,…
SPLn be a number of n measured sound pressure levels
Then the average of these n
readings is :
10 log [![]() (10 0.1SPL1 +
10 0.1SPL2 + ……….+ 10 0.1SPLn)
(10 0.1SPL1 +
10 0.1SPL2 + ……….+ 10 0.1SPLn)
Worked Example
A noise meter displays SPL
readings at every 1 second interval. Over 10 seconds, the following readings
are obtained: 70.3, 77.5, 72.4, 80.3, 79.5, 70.1, 71.8, 76.1, 80.5 and 77.7
dB(A). Estimate the resulting Leq (10-s) level.
Answer:
Leq (10-s) = 10 log (1/10) {10 7.03
+ 10 7.75 + 10 7.24 + 10 8.03 + 10 7.95
+ 10 7.01
+
10 7.18 + 10 7.61 + 10 8.05 + 10 7.77}
= 10 log (1/10) {500419131}
= 10 (7.699)
= 77 dB(A)
Loudness vs. Frequency
The seminal work on loudness was
done at Bell Laboratories by Fletcher and Munson and reported in 1933, and
refinements have been added by others since that time. The family of equal-loudness
contours of Fig. 2, the work of Robinson and Dadson, had been adopted as an
international standard (ISO 226)
Each equal-loudness contour is
identified by its value at 1,000 Hz, and the term loudness level in phons is thus defined. For example, the
equal-loudness contour passing through 40-dB sound-pressure level at 1,000 Hz
is called the 40-phon contour. Loudness is a subjective term; sound-pressure
level is strictly a physical term. Loudness level is also a physical term that
is useful in estimating the loudness of sound (in units of sones) from
sound-level measurements. The shapes of the equal-loudness contours contain
subjective information because they were obtained by a subjective comparison of
the loudness of a tone to its loudness at 1,000 Hz.
The surprising thing about the curves of Fig. 2 is that they reveal that perceived loudness varies greatly with frequency and sound-pressure level. For example, a sound-pressure level of 30 dB yields a loudness level of 30 phons at 1,000 Hz, but it requires a sound-pressure level of 58 dB more to sound equally loud at 20 Hz as shown in Fig. 3. The curves tend to flatten at the higher sound levels. The 90-phon curve rises only 32 dB between 1,000 Hz and 20 Hz. Note that inverting the curves of Fig 3 gives the frequency response of the ear in terms of loudness level. The ear is less sensitive to bass notes than mid-band notes at low levels. There are wiggles in the ear’s high frequency response that are relatively less noticeable. This bass problem of the ear means that the quality of reproduced music depends on the volume-control setting. Listening to background music at low levels requires a different frequency response than listening at higher levels.
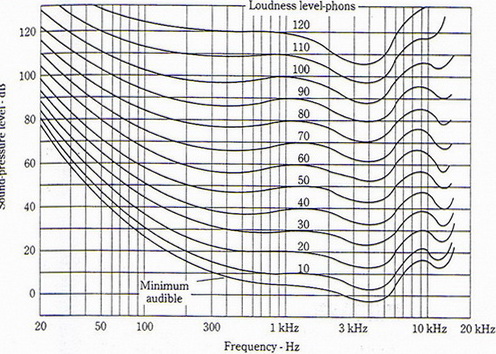
Figure 2
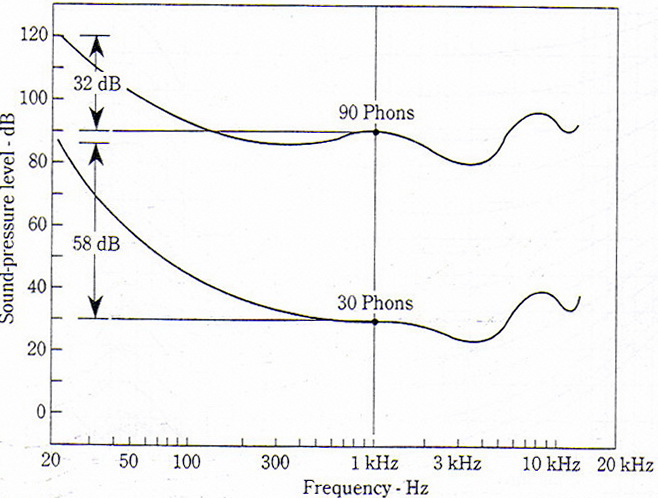
Figure 3
Measuring Sound-Pressure Level
A sound level meter is designed
to give readings of sound-pressure level; sound pressure in decibels referred
to the standard reference level, 20 mPa. Sound level meters usually
offer a selection of weighting networks designated A, B and C having frequency
responses shown in Fig 4. Network selection is based on the general level of
sounds to be measured (background noise? Jet engines?), such as:
·
For sound-pressure levels of 20 - 55 dB … use network A.
·
For sound-pressure levels of 55 - 85 dB … use network B.
·
For sound-pressure levels of 85 - 140 dB … use network C.
These network response shapes are designed to bring the sound level meter readings into closer conformance to the relative loudness of sounds.
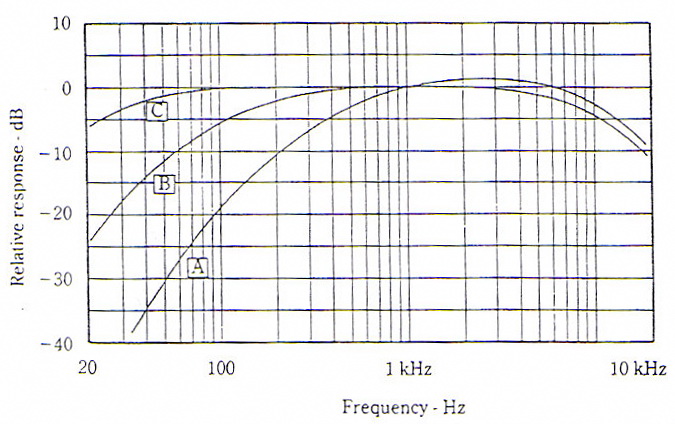
Figure 4
Addition / subtraction of sound pressure levels
Let SPL1, SPL2,….SPLn
be a number of n measured sound pressure levels
To add these n readings together,
the result is
10 log [10 0.1 SPL1 +
10 0.1 SPL2 + ….. + 10 0.1 SPLn)
Worked
Examples
1.
The SPL at a measuring position is 80 dB when machine A is switched on.
With machine B is on alone, the SPL is 86 dB. What is the SPL at the same
position when both machines are turned on simultaneously?
Solution:
SPLt = 10 log {10 8.0
+ 10 8.6}
= 86.97
dB
2.
The background noise level in a workshop is 70 dB. When a machine
operates in this workshop produced a combined noise level of 75 dB. What is the
noise level due to the machine alone?
Solution:
SPL2 = 10 log {10 7.5
- 10 7.0}
= 73.3 dB
Sound Level Meter
The
sound level meter used for sound measurement in accordance with EN 71-1 / ASTM
F963-07 should comply with the following standards:
IEC 61672 - Electroacoustics - Sound level meters
An IEC standard which
is split into 2 parts:
IEC 61672-1:2002 - Electroacoustics - Sound level meters - Part 1:
Specifications
IEC 61672-2:2003 - Electroacoustics - Sound level meters - Part 2: Pattern
evaluation tests
Part 1 gives electroacoustical performance specifications for
three kinds of sound measuring instruments:
- a conventional sound level meter that measures exponential time-weighted
sound level;
- an integrating-averaging sound level meter that measures time-average sound
level; and
- an integrating sound level meter that measures sound exposure level.
A single instrument may make any, or all, of the three kinds of measurements.
Two performance categories, class 1 and class 2, are specified in this
standard. In general, specifications for class 1 and class 2 sound level meters
have the same design goals and differ mainly in the tolerance limits and the
range of operational temperatures. Tolerance limits for class 2 specifications
are greater than, or equal to, those for class 1 specifications.
Sound level meters conforming to the requirements of this standard have a
specified frequency response for sound incident on the microphone from one
principal direction in an acoustic free field or from random directions.
Part 2 provides details of the tests
necessary to verify conformance to all mandatory specifications given in IEC
61672-1:2002 for conventional sound level meters, integrating-averaging sound
level meters and integrating sound level meters.
Pattern evaluation tests apply for each channel of a multi-channel sound level
meter, as appropriate. Tests and test methods are applicable to class 1 and
class 2 sound level meters. The aim is to ensure that all testing laboratories
use consistent methods to perform pattern evaluation tests.
© 2005, 2010 Professional Testing & Consulting Ltd. All rights reserved.